Fig. 10
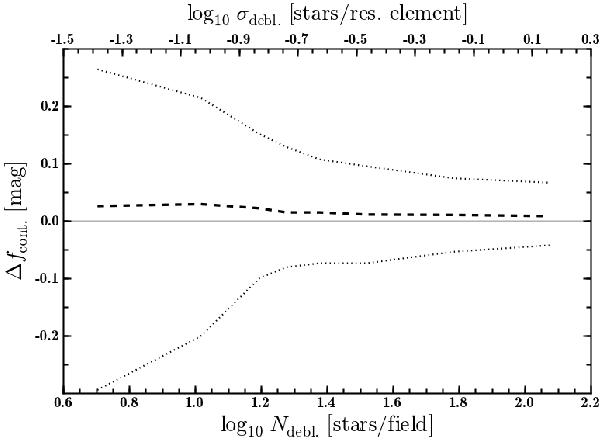
The recovered continuum level of extracted spectra as a function of the number of stars in the source list, from the analysis of 100 simulated crowded field datacubes. The number of stars is given per datacube in the bottom and per resolution element in the top label. A thick dashed line is used to indicate the median continuum error of the brightest 10 stars per cube, and dotted lines enclose the 75% percentiles of the distribution.
Current usage metrics show cumulative count of Article Views (full-text article views including HTML views, PDF and ePub downloads, according to the available data) and Abstracts Views on Vision4Press platform.
Data correspond to usage on the plateform after 2015. The current usage metrics is available 48-96 hours after online publication and is updated daily on week days.
Initial download of the metrics may take a while.