Fig. 7
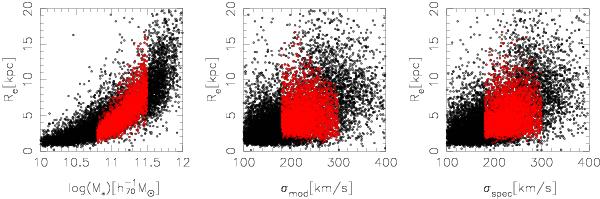
Effective radius as a function of stellar mass (left), model
velocity dispersion (middle), and spectroscopic velocity dispersion
(middle). The black dots show all galaxies with high-concentration
brightness profiles with z < 0.2, the red dots
are the lenses that satisfy
180 km s-1 < σmod < 300 km s-1,
180 km s-1 < σspec < 300 km s-1,
δσspec/σspec < 0.15,
and 10.8 
 . By using all selection criteria
simultaneously, we exclude large galaxies at low stellar masses and high model
velocity dispersions, and small galaxies in the velocity dispersion samples.
. By using all selection criteria
simultaneously, we exclude large galaxies at low stellar masses and high model
velocity dispersions, and small galaxies in the velocity dispersion samples.
Current usage metrics show cumulative count of Article Views (full-text article views including HTML views, PDF and ePub downloads, according to the available data) and Abstracts Views on Vision4Press platform.
Data correspond to usage on the plateform after 2015. The current usage metrics is available 48-96 hours after online publication and is updated daily on week days.
Initial download of the metrics may take a while.