Fig. 5
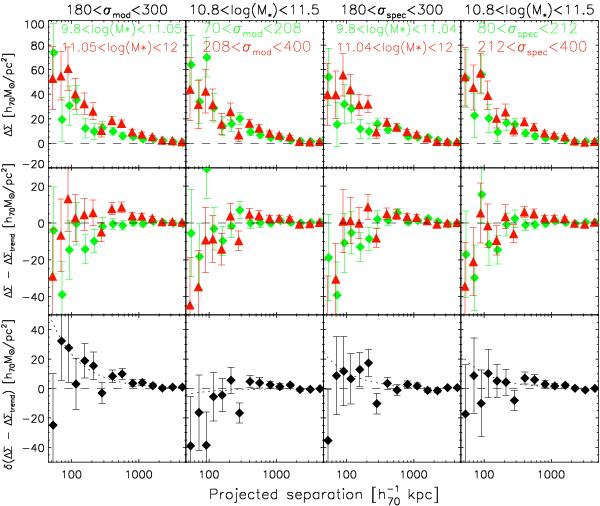
Dependence of the lensing signal on stellar mass and velocity dispersion. In the top row, we show the lensing signal ΔΣ as a function of physical distance from the lens, for the lens samples that have been split by the median value of one of the observables, as indicated in the plots. Red triangles (green diamonds) indicate the signal of the lenses with higher (lower) stellar masses/velocity dispersions. In the middle row, we show the lensing signal of the same samples after we subtracted the trend with the observable that is indicated on top of each column. The difference between the residual trends for the two lens samples are shown in the bottom row. A residual trend indicates that the lensing signal has a residual dependence on the observable indicated inside the corresponding panel of the first row, after removing the dependence on the observable indicated on top of that column. The dotted lines show the best-fit SIS profiles to the difference between the residuals.
Current usage metrics show cumulative count of Article Views (full-text article views including HTML views, PDF and ePub downloads, according to the available data) and Abstracts Views on Vision4Press platform.
Data correspond to usage on the plateform after 2015. The current usage metrics is available 48-96 hours after online publication and is updated daily on week days.
Initial download of the metrics may take a while.