Free Access
Fig. 4
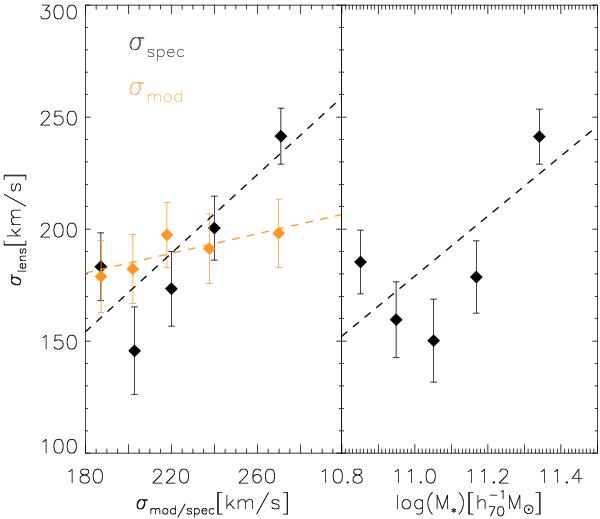
Best-fit lensing velocity dispersion as a function of spectroscopic velocity dispersion (left panel, black), model velocity dispersion (left panel, orange) and stellar mass (right panel). Dashed lines indicate the best-fit linear relation between the observable and σlens.
Current usage metrics show cumulative count of Article Views (full-text article views including HTML views, PDF and ePub downloads, according to the available data) and Abstracts Views on Vision4Press platform.
Data correspond to usage on the plateform after 2015. The current usage metrics is available 48-96 hours after online publication and is updated daily on week days.
Initial download of the metrics may take a while.