Fig. 1
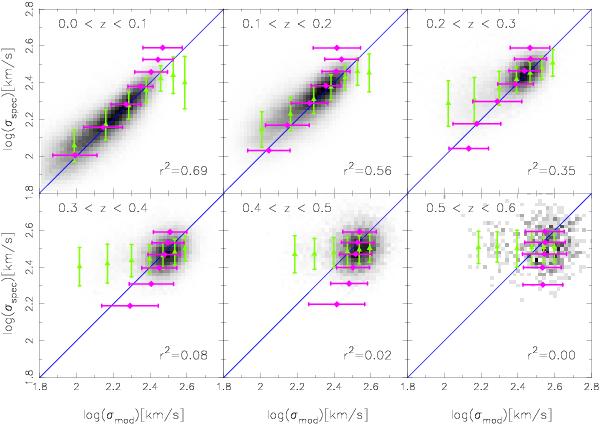
Comparison of the spectroscopic velocity dispersions to the model velocity dispersions for all galaxies with SDSS spectroscopy. The green triangles show the average spectroscopic velocity dispersion for bins of model velocity dispersion, the purple diamonds show the average model velocity dispersion for bins of spectroscopic velocity dispersion. The error bars indicate the scatter. The blue line shows the one-to-one correspondence. Only galaxies with a spectroscopic velocity dispersion error smaller than 15% have been used in the comparison. The velocity dispersions correlate well at z < 0.2, but at z > 0.2 the range in velocity dispersion becomes too narrow to assess whether this is still the case. The square of the correlation coefficient r2 of the galaxies in the range 1.8 < log 10(σmod/spec) < 2.8 km s-1 is shown in the lower right corner of each panel.
Current usage metrics show cumulative count of Article Views (full-text article views including HTML views, PDF and ePub downloads, according to the available data) and Abstracts Views on Vision4Press platform.
Data correspond to usage on the plateform after 2015. The current usage metrics is available 48-96 hours after online publication and is updated daily on week days.
Initial download of the metrics may take a while.