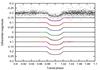
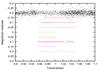
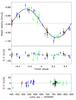
Fig. 1

Photometry and radial velocities of WASP-52. The two upper panels show the transit light curves and their residuals from the fit. Different photometric observations are ranked chronologically from top to bottom with the same order as in Table 2. The three lower plots show the phase-folded radial velocities and their O−C residuals from the Keplerian fit as a function of transit phase and Julian date. The data are presented as follows: SOPHIE HE1 (red circles), HE2 (blue diamonds), HR (black downward triangles), and CORALIE (green upward triangles) – see Table 4.
Current usage metrics show cumulative count of Article Views (full-text article views including HTML views, PDF and ePub downloads, according to the available data) and Abstracts Views on Vision4Press platform.
Data correspond to usage on the plateform after 2015. The current usage metrics is available 48-96 hours after online publication and is updated daily on week days.
Initial download of the metrics may take a while.