Fig. 7
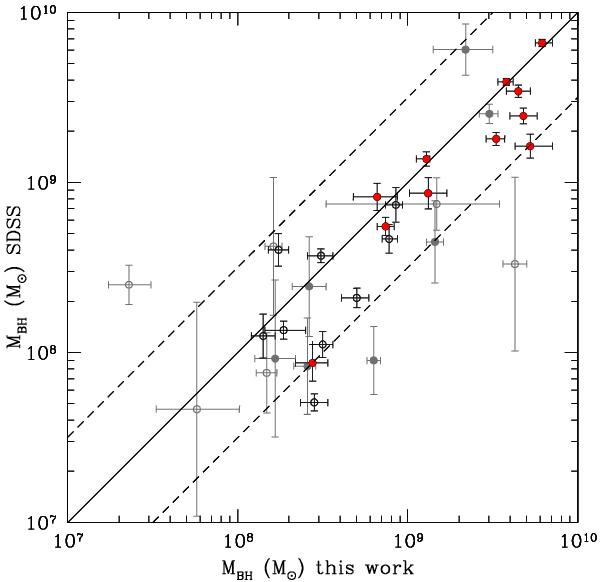
Comparison between black-hole masses computed in this paper and those computed by Shen et al. (2011), for the XBS AGNs included in the SDSS sample. Red and black points represent the objects with higher signal-to-noise ratio (>5) and smaller uncertainties on the mass derivation (<0.2 dex). Grey points, instead, represent the data with lower S/N and/or larger error bars. Filled (and red, in electronic version) points are sources for which we have used the SDSS spectrum to derive the BH mass, while open points indicate sources for which we used an optical spectrum taken in our own observations. As reference we plot the relation 1:1 (solid line), while the two dashed lines represent a scatter of 0.5 dex.
Current usage metrics show cumulative count of Article Views (full-text article views including HTML views, PDF and ePub downloads, according to the available data) and Abstracts Views on Vision4Press platform.
Data correspond to usage on the plateform after 2015. The current usage metrics is available 48-96 hours after online publication and is updated daily on week days.
Initial download of the metrics may take a while.