Fig. 6
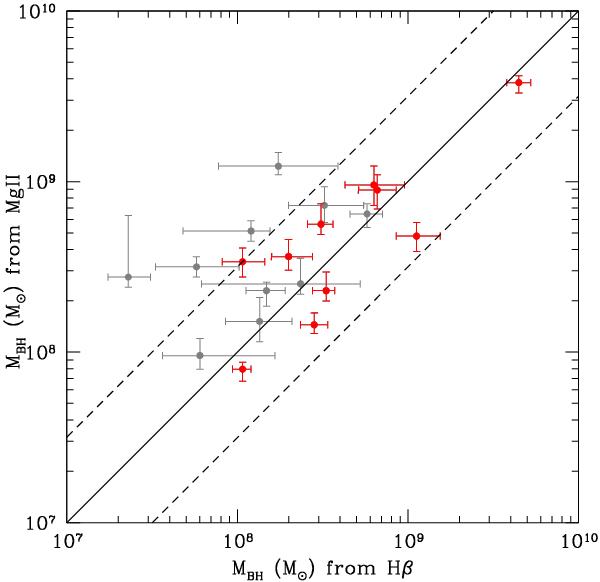
Comparison between black-hole masses computed on the basis of the MgIIλ2798 Å and the Hβ lines for the XBS AGNs where both lines are included in the spectrum. Red points represent sources with a relatively high S/N (>5) around the line of interest and with lower statistical error bars (<0.2 dex) while grey points are objects with lower S/N spectra and/or larger error bars. As reference we plot the relation 1:1 (solid line), while the two dashed lines represent a scatter of 0.5 dex.
Current usage metrics show cumulative count of Article Views (full-text article views including HTML views, PDF and ePub downloads, according to the available data) and Abstracts Views on Vision4Press platform.
Data correspond to usage on the plateform after 2015. The current usage metrics is available 48-96 hours after online publication and is updated daily on week days.
Initial download of the metrics may take a while.