Fig. 2
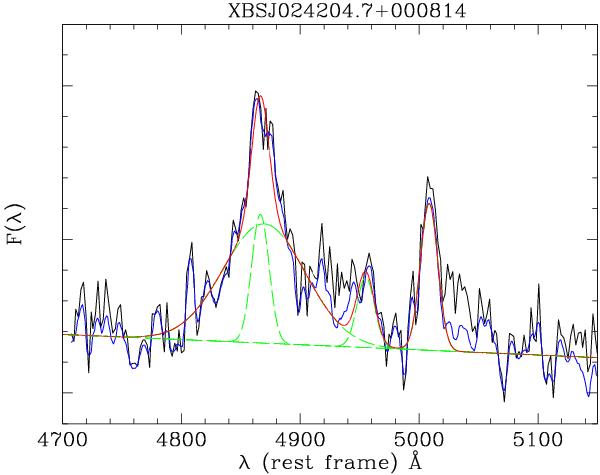
Example of a spectral model used to fit the region around the Hβ line. As described in the text, we first subtract an iron template from the spectrum (black line) and then we fit the residual (blue line) with a power-law continuum plus 3 Gaussians describing the narrow Hβ and the two [OIII] lines, plus an additional Gaussian to describe the broad component of the Hβ line. These components are represented by the dashed green lines while the total fit is represented by the red continuous line.
Current usage metrics show cumulative count of Article Views (full-text article views including HTML views, PDF and ePub downloads, according to the available data) and Abstracts Views on Vision4Press platform.
Data correspond to usage on the plateform after 2015. The current usage metrics is available 48-96 hours after online publication and is updated daily on week days.
Initial download of the metrics may take a while.