Fig. 2
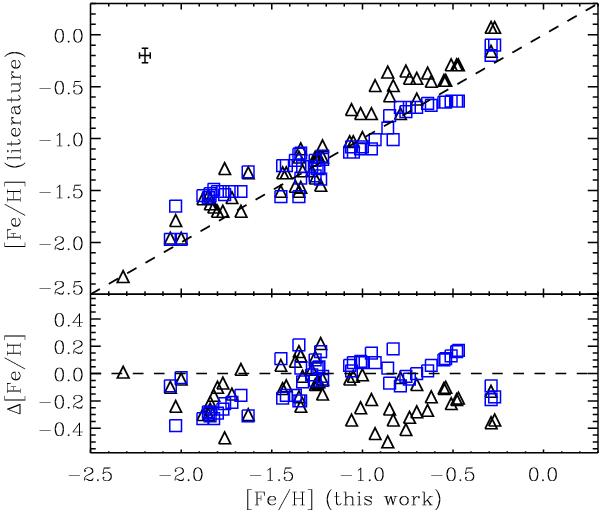
Top panel: comparison of metallicities obtained with the spectral fitting (this work) versus the values compiled in literature by Schiavon et al. (2005) (blue squares) and Carretta et al. (2009) (black triangles) for the Galactic GCs. The error bar in the top left corner indicates the mean error values. Bottom panel: [Fe/H] residuals (ours minus literature values).
Current usage metrics show cumulative count of Article Views (full-text article views including HTML views, PDF and ePub downloads, according to the available data) and Abstracts Views on Vision4Press platform.
Data correspond to usage on the plateform after 2015. The current usage metrics is available 48-96 hours after online publication and is updated daily on week days.
Initial download of the metrics may take a while.