Fig. A.1
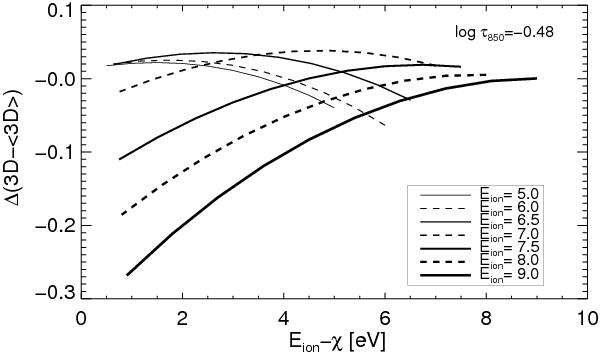
Abundance correction Δ3D − ⟨ 3D ⟩ , computed according to Eqs. (A.1)–(A.4), versus the difference between ionization and excitation potential, Eion − χ. Each curve corresponds to a different value of Eion. The thermodynamic variables θ(x,y) and pe(x,y) were taken from the 3D model at monochromatic optical depth log τ850 = −0.48, where the mean temperature is 3360 ± 140 K. The temperature dependence of the partition functions U0 and U1 has been neglected.
Current usage metrics show cumulative count of Article Views (full-text article views including HTML views, PDF and ePub downloads, according to the available data) and Abstracts Views on Vision4Press platform.
Data correspond to usage on the plateform after 2015. The current usage metrics is available 48-96 hours after online publication and is updated daily on week days.
Initial download of the metrics may take a while.