Fig. 5
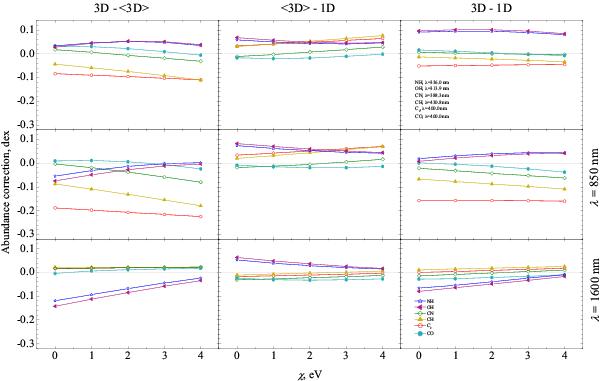
Same as in Fig. 4 but for molecular lines. The bluest wavelength (top row) corresponds to the real wavelength of molecular bands in this spectral range (see legend), except for C2 and CO, which do not have bands in the UV. The curve corresponding to C2 coincides with that of CN in the lower left panel. Note the different y-scale in the lowest three panels.
Current usage metrics show cumulative count of Article Views (full-text article views including HTML views, PDF and ePub downloads, according to the available data) and Abstracts Views on Vision4Press platform.
Data correspond to usage on the plateform after 2015. The current usage metrics is available 48-96 hours after online publication and is updated daily on week days.
Initial download of the metrics may take a while.