Fig. B.5
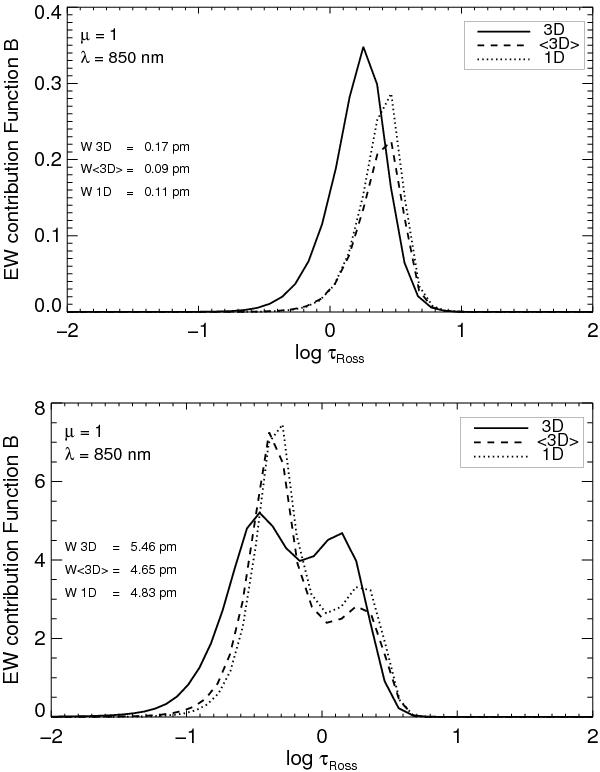
Disk-center (μ = 1) equivalent width contribution functions, ℬ(log τc), of a weak (top) and strong (bottom) Fe ii line with excitation potential χ = 10 eV, at λ 850 nm. The contribution functions have been computed for a single snapshot of the 3D model (solid), the corresponding ⟨ 3D ⟩ average model (dashed), and the associated 1D LHD model (dotted) used in this work. They have been transformed from the monochromatic to the Rosseland optical depth scale. In all cases, the saturation factor exp { − τℓ } is properly taken into account (see Eq. (B.1)).
Current usage metrics show cumulative count of Article Views (full-text article views including HTML views, PDF and ePub downloads, according to the available data) and Abstracts Views on Vision4Press platform.
Data correspond to usage on the plateform after 2015. The current usage metrics is available 48-96 hours after online publication and is updated daily on week days.
Initial download of the metrics may take a while.