Fig. B.4
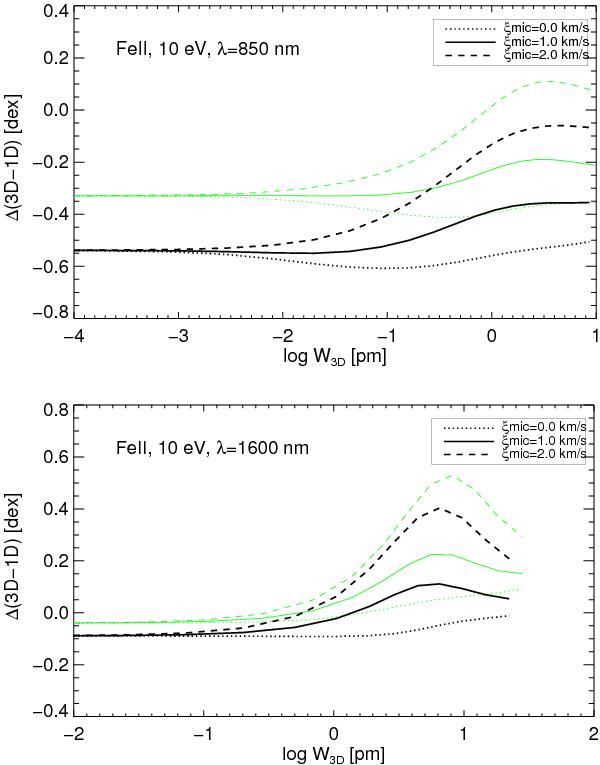
Total 3D abundance correction Δ3D−1D for the artificial Fe ii line with excitation potential χ = 10 eV at λ 850 nm (top) and λ 1600 nm (bottom) as a function of the equivalent width obtained from the 3D model. The fainter (green) curves and the thicker (black) curves refer to the intensity (μ = 1) and flux spectrum, respectively. The abundance corrections have been computed for three different values of the microturbulence parameter used with the 1D model, ξmic = 0.0 (dotted), 1.0 (solid), and 2.0 km s-1 (dashed lines). The weak line limit coincides with the horizontal part of the curves at low log W3D.
Current usage metrics show cumulative count of Article Views (full-text article views including HTML views, PDF and ePub downloads, according to the available data) and Abstracts Views on Vision4Press platform.
Data correspond to usage on the plateform after 2015. The current usage metrics is available 48-96 hours after online publication and is updated daily on week days.
Initial download of the metrics may take a while.