Fig. B.3
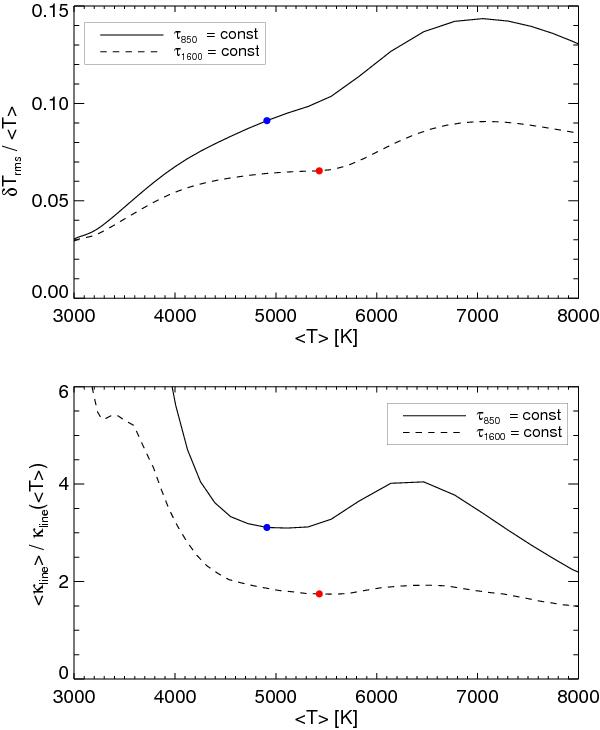
Amplitude of the (relative) temperature fluctuations,
δTrms/ ⟨ T ⟩
(top), and ratio of average line opacity to line opacity at
mean temperature,  of a weak (artificial) Fe ii line with excitation potential
χ = 10 eV (bottom) as a function of the
mean temperature ⟨ T ⟩ , where angle brackets indicate
horizontal averaging at constant monochromatic optical depth. Solid and dashed
curves show the results of averaging on surfaces of constant
τ850 and constant
τ1600, respectively. Filled dots indicate the
location of the center of the line formation regions at
λ 8500 and 1600 nm.
of a weak (artificial) Fe ii line with excitation potential
χ = 10 eV (bottom) as a function of the
mean temperature ⟨ T ⟩ , where angle brackets indicate
horizontal averaging at constant monochromatic optical depth. Solid and dashed
curves show the results of averaging on surfaces of constant
τ850 and constant
τ1600, respectively. Filled dots indicate the
location of the center of the line formation regions at
λ 8500 and 1600 nm.
Current usage metrics show cumulative count of Article Views (full-text article views including HTML views, PDF and ePub downloads, according to the available data) and Abstracts Views on Vision4Press platform.
Data correspond to usage on the plateform after 2015. The current usage metrics is available 48-96 hours after online publication and is updated daily on week days.
Initial download of the metrics may take a while.