Fig. 1
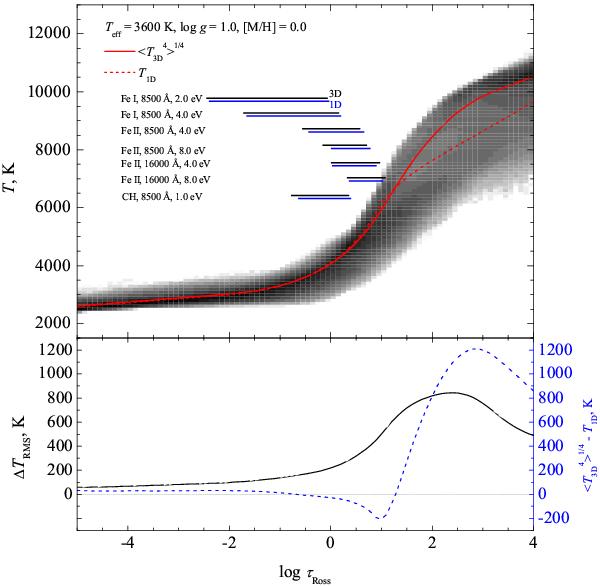
Top panel: temperature profiles in the three model atmospheres of a red giant: 3D hydrodynamical (gray scales showing the logarithmic probability density of the 14-snapshot ensemble), average ⟨3D⟩ (red solid line, average over the 14-snapshot ensemble), and 1D LHD model atmosphere with αMLT = 1.0 (red dashed line). Horizontal bars indicate approximate formation regions of Fe i, Fe ii, and CH lines in the 3D and 1D models, at different wavelengths and line excitation potentials (bars mark the regions where 90% of line equivalent width is acquired, i.e., between 5% and 95% in the cumulative line depression contribution function, see Appendix B). Bottom panel: rms horizontal temperature fluctuations at constant τRossin the 3D model (black solid line, 14-snapshot ensemble); and the difference between the temperature profiles corresponding to the average ⟨3D⟩ (14-snapshot ensemble average) and the 1D model (blue dashed line).
Current usage metrics show cumulative count of Article Views (full-text article views including HTML views, PDF and ePub downloads, according to the available data) and Abstracts Views on Vision4Press platform.
Data correspond to usage on the plateform after 2015. The current usage metrics is available 48-96 hours after online publication and is updated daily on week days.
Initial download of the metrics may take a while.