Fig. 7
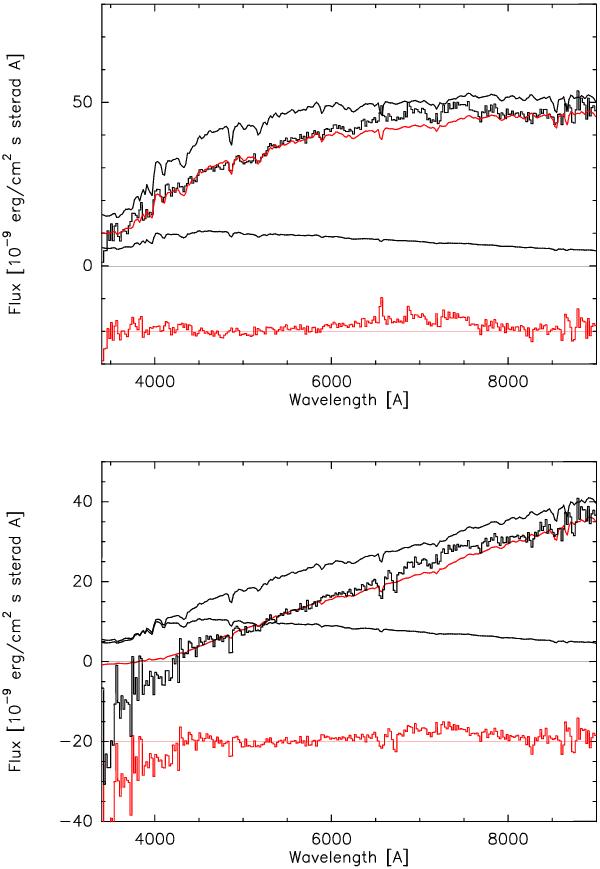
Fitting of the TPN spectra with ISL model spectrum. The upper panel
is for the bright rim. The observed spectrum is shown as a histogram (thick
black line). The upper and the lower continuous thin line in black show ISL model
spectra for the bright rim and the sky positions, respectively. Their difference,
the red continuous line, is the fit. The parameters used for the model spectrum were
 mag and
C5000 = 0.66. The residuals observation-minus-fit are
shown as histogram (in red), shifted down by 20 units. The lower panel
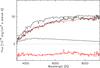
shows the core. Same as for the rim but the parameters used for the model
fit were
mag and
C5000 = 0.66. The residuals observation-minus-fit are
shown as histogram (in red), shifted down by 20 units. The lower panel
shows the core. Same as for the rim but the parameters used for the model
fit were  mag and
C5000 = 0.33.
mag and
C5000 = 0.33.
Current usage metrics show cumulative count of Article Views (full-text article views including HTML views, PDF and ePub downloads, according to the available data) and Abstracts Views on Vision4Press platform.
Data correspond to usage on the plateform after 2015. The current usage metrics is available 48-96 hours after online publication and is updated daily on week days.
Initial download of the metrics may take a while.