Fig. 5
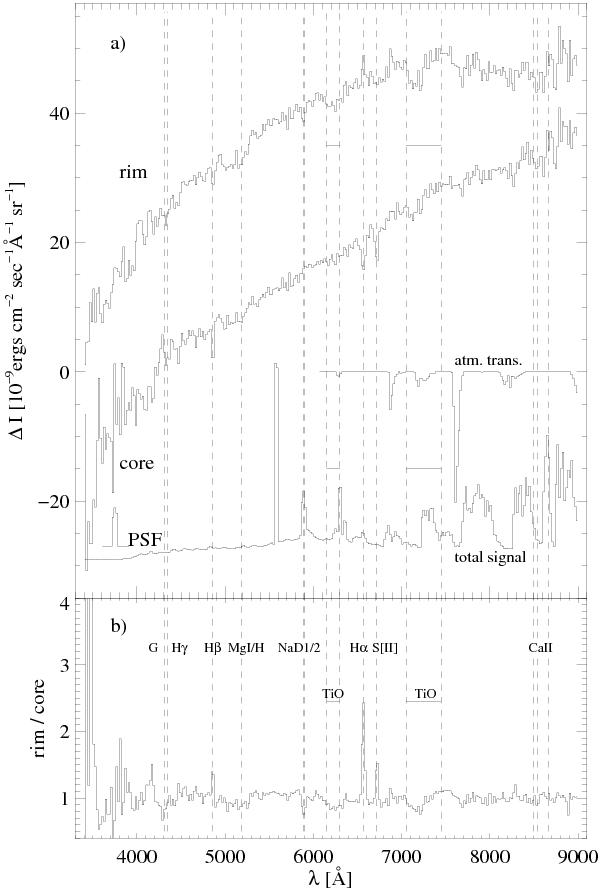
Spectrum of diffuse light for TPN. Intensity ΔI is given relative to the background sky adjacent to the globule. Panel a) shows the spectra for the dark core and the mean of the bright rims. Panel b) shows the ratio of the rim and the core spectrum after fitting and subtracting the continuum of the spectra and scaling the spectra to unity. The wavelengths of spectral lines and bands are marked with dashed lines. The spectral resolution of the measurements (PSF) is shown. The atmospheric transmission between ~6000−9000 Å and the total measured signal (including the atmospheric emission lines) are shown in panel a) for reference, in arbitrary scale.
Current usage metrics show cumulative count of Article Views (full-text article views including HTML views, PDF and ePub downloads, according to the available data) and Abstracts Views on Vision4Press platform.
Data correspond to usage on the plateform after 2015. The current usage metrics is available 48-96 hours after online publication and is updated daily on week days.
Initial download of the metrics may take a while.