Fig. 3
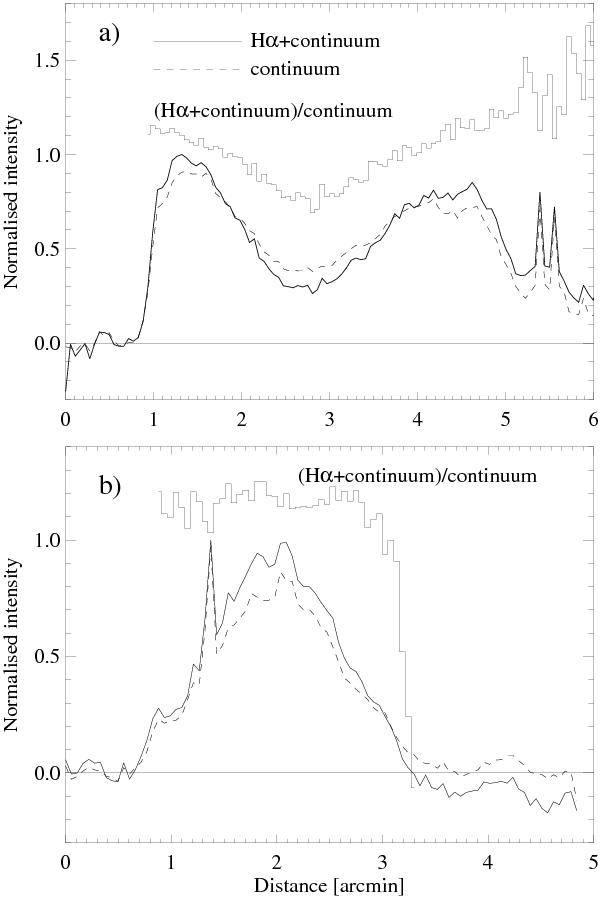
Surface brightness profiles across the globules in a band containing the Hα and [N ii] lines, together with the underlying continuum (solid line) and the adjacent continuum (dashed line) as well as their ratio (histogram). Panel a) is for TPN, panel b) for DC 303. The narrow peaks in the profiles are stars. The ratio is shown only for the region where the continuum intensity is not close to zero. The outer, northern boundary of DC 303 is on the left-hand side of the bright rim at ~0.7′.
Current usage metrics show cumulative count of Article Views (full-text article views including HTML views, PDF and ePub downloads, according to the available data) and Abstracts Views on Vision4Press platform.
Data correspond to usage on the plateform after 2015. The current usage metrics is available 48-96 hours after online publication and is updated daily on week days.
Initial download of the metrics may take a while.