Fig. 2
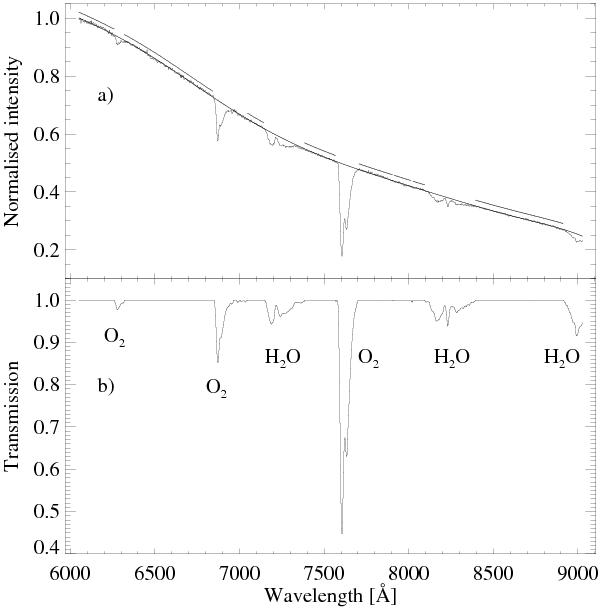
Derivation of atmospheric transmission. The observed spectrum of the standard star LTT4362 (histogram), overplotted by a Chebyshev fit (solid line) to the continuum of the spectrum. The regions that are defined to represent the continuum are shown as intermittent lines above the fit a). The derived atmospheric transmission spectrum at airmass of unity b). The molecular bands of the spectrum are identified.
Current usage metrics show cumulative count of Article Views (full-text article views including HTML views, PDF and ePub downloads, according to the available data) and Abstracts Views on Vision4Press platform.
Data correspond to usage on the plateform after 2015. The current usage metrics is available 48-96 hours after online publication and is updated daily on week days.
Initial download of the metrics may take a while.