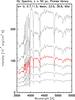
Fig. A.1
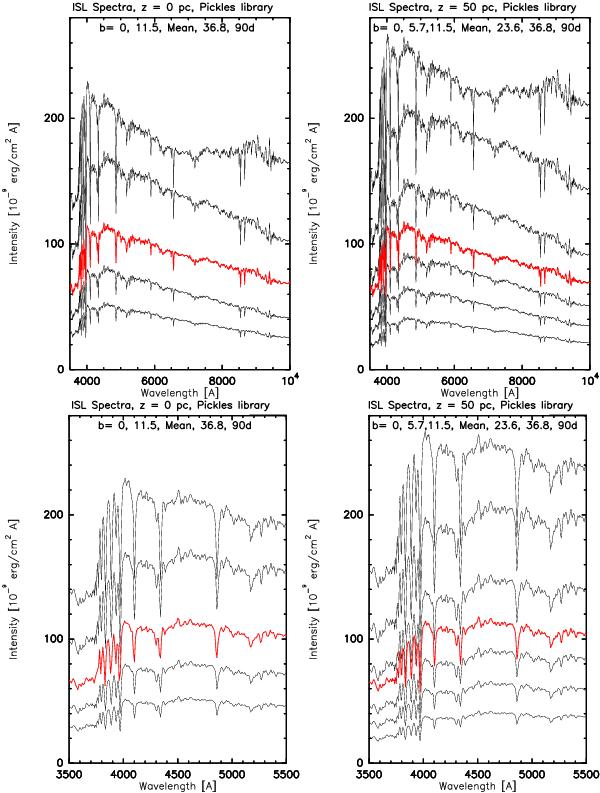
Integrated starlight spectra for different Galactic latitudes and for two positions of the observer, z = 0 and z = 50 pc. The upper panels show the wavelength range 3500–10 000 Å, the lower panels show the wavelength range 3500–5500 Å. For z = 0 pc the spectra are shown from bottom to top for b = 90,36.8,11.5, and 0 deg as a black line. For z = 50 pc the spectra are shown from bottom to top for b = 90,36.8,23.6,11.5,5.7, and 0 deg as a black line. The mean spectra over the sky are shown as a red line. All spectra have the same scale and zero point.
Current usage metrics show cumulative count of Article Views (full-text article views including HTML views, PDF and ePub downloads, according to the available data) and Abstracts Views on Vision4Press platform.
Data correspond to usage on the plateform after 2015. The current usage metrics is available 48-96 hours after online publication and is updated daily on week days.
Initial download of the metrics may take a while.