Fig. 2
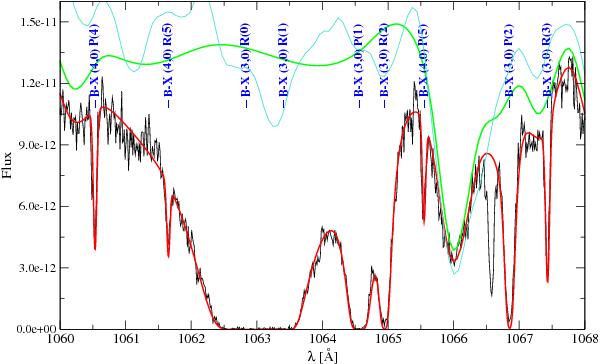
A fragment of FUSE spectra with the B–X (3,0) transitions of H2. The upper thick line represents continuum, and the bottom thick line is the simulated spectrum fitted to the observed one. The upper thin line is the stellar synthetic spectrum with rotational and instrumental broadening. The absorption line at 1066.66 Å is an Ar i line.
Current usage metrics show cumulative count of Article Views (full-text article views including HTML views, PDF and ePub downloads, according to the available data) and Abstracts Views on Vision4Press platform.
Data correspond to usage on the plateform after 2015. The current usage metrics is available 48-96 hours after online publication and is updated daily on week days.
Initial download of the metrics may take a while.