Fig. 1
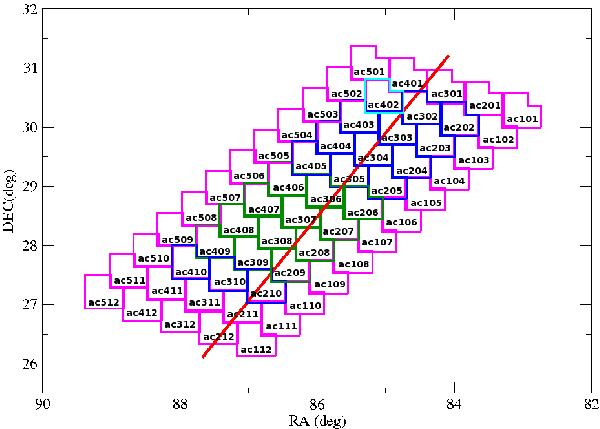
Plot of the 60 WFC fields observed. Red line shows the  5 plane. In green: central fields observed during 2009A run. Dark blue: central fields observed during 2010B run. Light blue: a central field observed during the 2011A run with a longer exposure time. Pink: outer fields observed during 2011A run with shorter exposure times and a single observation per field. The anticenter fields are named acij, where i = 1,...,5, and j = 01,...,12.
Current usage metrics show cumulative count of Article Views (full-text article views including HTML views, PDF and ePub downloads, according to the available data) and Abstracts Views on Vision4Press platform.
Data correspond to usage on the plateform after 2015. The current usage metrics is available 48-96 hours after online publication and is updated daily on week days.
Initial download of the metrics may take a while.