Fig. 6
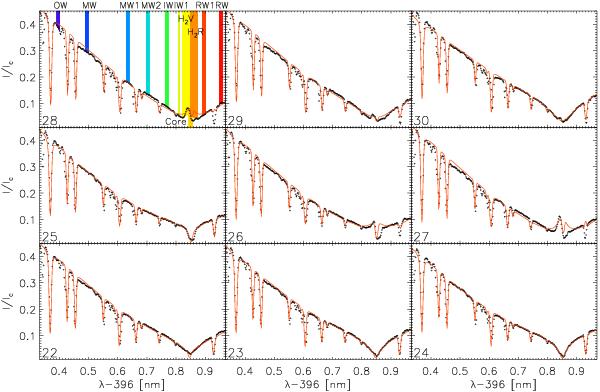
Example spectra during the passage of a (shock) wave. Observations are given by black pluses and the best-fit spectra by red lines. The temporal cadence between subsequent spectra is 21 s. Time increases from left to right in each row and from bottom to top between rows. The coloured bars in the upper left panel denote the wavelength bands used later on.
Current usage metrics show cumulative count of Article Views (full-text article views including HTML views, PDF and ePub downloads, according to the available data) and Abstracts Views on Vision4Press platform.
Data correspond to usage on the plateform after 2015. The current usage metrics is available 48-96 hours after online publication and is updated daily on week days.
Initial download of the metrics may take a while.