Fig. 3
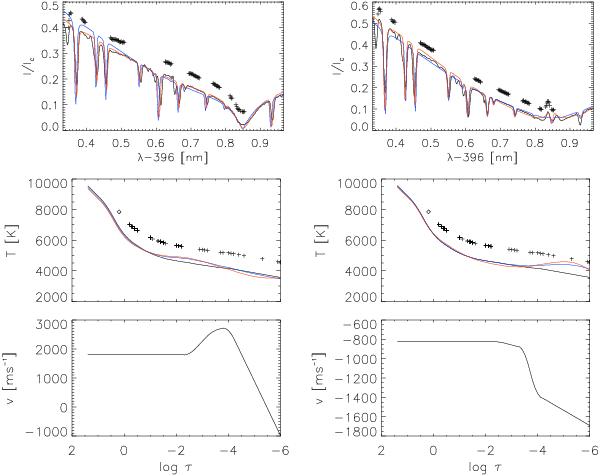
Iterative improvement of the best-fit archive spectrum for two example spectra without (left column) and with emission in the line core (right column). Top row: observed spectrum (black line), best-fit archive spectrum (blue), and final best-fit spectrum (red). The black crosses denote the wavelengths and intensities used for the improvement of the fit. 2nd row: temperature stratifications (blue: archive best-fit, red: final best-fit, black: modified HSRA model). The black crosses denote the optical depths corresponding to the wavelengths marked above. The diamond at log τ = 0.2 denotes the 630 nm continuum intensity contribution. Bottom row: stratification of the LOS velocity.
Current usage metrics show cumulative count of Article Views (full-text article views including HTML views, PDF and ePub downloads, according to the available data) and Abstracts Views on Vision4Press platform.
Data correspond to usage on the plateform after 2015. The current usage metrics is available 48-96 hours after online publication and is updated daily on week days.
Initial download of the metrics may take a while.