Fig. 2
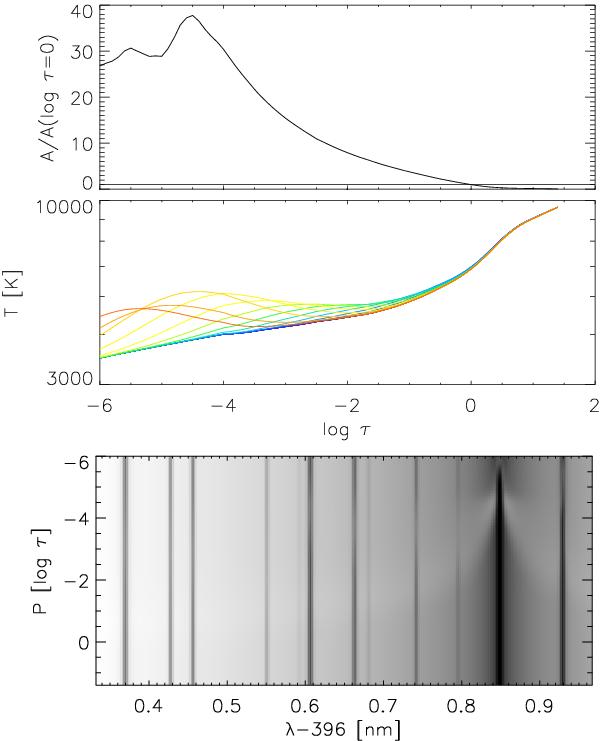
Top: scaling law for the temperature amplitude with optical depth. Middle: example of temperature stratifications with the Gaussian perturbation centred subsequently at decreasing optical depth. Bottom: the 75 synthesized spectra corresponding to the temperature stratifications above for the Gaussian perturbation centred subsequently at the location P from +1.4 (lowermost spectrum) to −6 (topmost spectrum) in log τ.
Current usage metrics show cumulative count of Article Views (full-text article views including HTML views, PDF and ePub downloads, according to the available data) and Abstracts Views on Vision4Press platform.
Data correspond to usage on the plateform after 2015. The current usage metrics is available 48-96 hours after online publication and is updated daily on week days.
Initial download of the metrics may take a while.