Fig. A.1
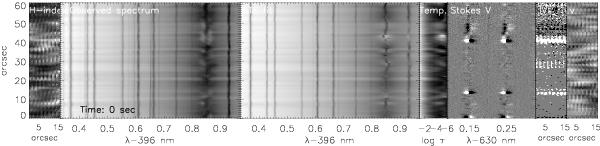
Still from an animation of the inversion results for the time series of the quiet Sun. Leftmost panel: 2D maps of the H-index for eight repetitions scanning the same area of 2′′ × 61′′. Time increases left to right. The scan step of the spectra shown in the other panels is always located at the very left border at 0′′. Second and third panels: observed and best-fit Ca spectra. Fourth panel: temperature stratifications along the slit corresponding to the best-fit spectra. Fifth panel: co-spatial and simultaneous Stokes V spectra at 630 nm. Sixth panel: 2D maps of the polarity of the Stokes V signal for eight repetitions scanning the same area. Seventh panel: 2D maps of the LOS velocity of the Fe i line at 630.15 nm for eight repetitions of scanning the same area.
Current usage metrics show cumulative count of Article Views (full-text article views including HTML views, PDF and ePub downloads, according to the available data) and Abstracts Views on Vision4Press platform.
Data correspond to usage on the plateform after 2015. The current usage metrics is available 48-96 hours after online publication and is updated daily on week days.
Initial download of the metrics may take a while.