Fig. 13
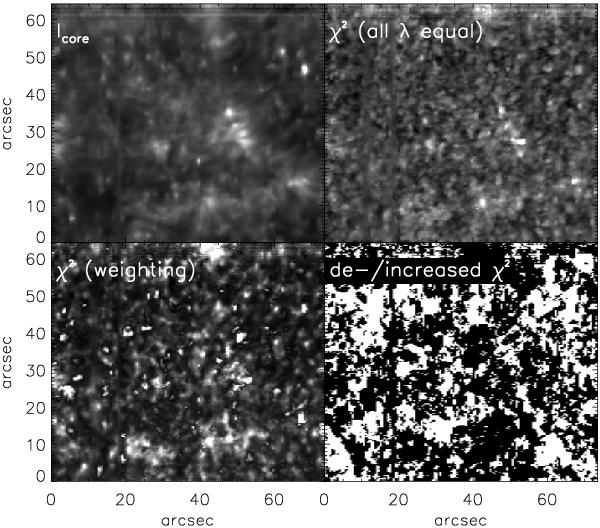
Spatial variation of the χ2 in the large-area QS scan. Top row, left: line-core intensity as indicator of the solar spatial structuring. Top right: χ2 with equal weight for all wavelengths. Bottom left: χ2 with enhanced weighting for the line core. Bottom right: decrease/increase in χ2 (white/black) by the iterative modification of the fit when considering enhanced weighting in the line core.
Current usage metrics show cumulative count of Article Views (full-text article views including HTML views, PDF and ePub downloads, according to the available data) and Abstracts Views on Vision4Press platform.
Data correspond to usage on the plateform after 2015. The current usage metrics is available 48-96 hours after online publication and is updated daily on week days.
Initial download of the metrics may take a while.