Fig. 12
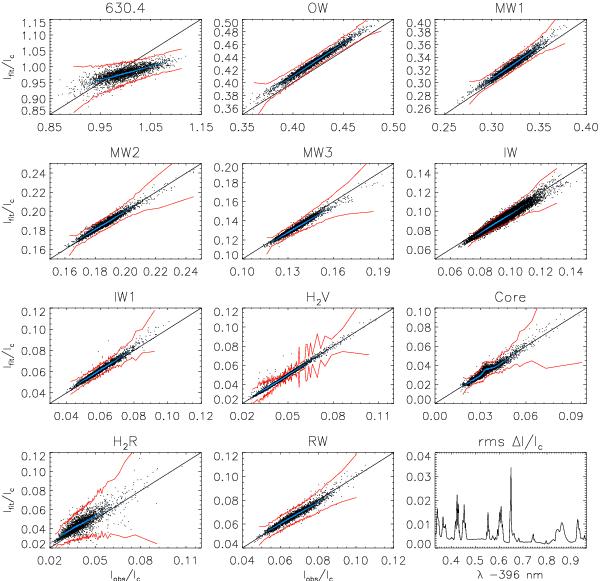
Scatter plots of observed and best-fit intensities (black dots) of the large-area scan on disc centre. The blue dots denote binned values whose 3-σ variation is denoted by the red lines. The solid black line denotes a one-to-one correlation. Bottom right panel: standard deviation of the difference between observed and best-fit intensity as a function of wavelength.
Current usage metrics show cumulative count of Article Views (full-text article views including HTML views, PDF and ePub downloads, according to the available data) and Abstracts Views on Vision4Press platform.
Data correspond to usage on the plateform after 2015. The current usage metrics is available 48-96 hours after online publication and is updated daily on week days.
Initial download of the metrics may take a while.