Fig. 10
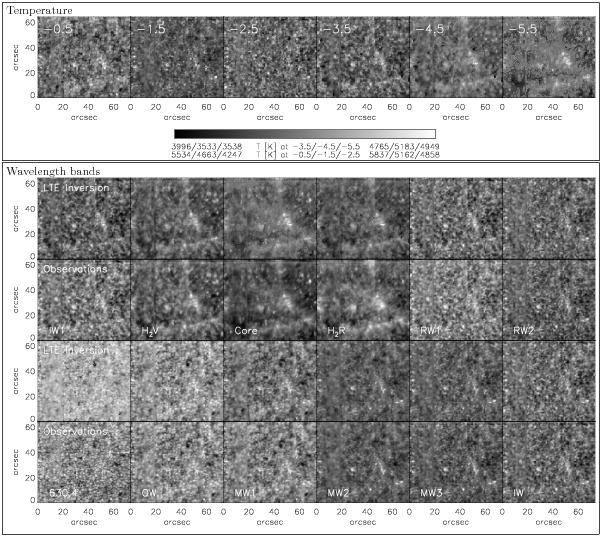
Bottom panel: 2D maps of wavelengths bands in the observed spectra (odd rows) and in the best-fit spectra (even rows) of the large-area scan on disc centre. The lower two rows show from left to right the continuum intensity at 630.4 nm, OW, MW1, MW2, MW3, and IW. The upper two rows show IW1, H2V, the line-core intensity, H2R, RW1, and RW2. Top panel: corresponding temperature maps at several optical depths from −0.5 to −5.5 in log τ (denoted at the top in each subpanel). See Fig. 9 for additional information on the grey bar.
Current usage metrics show cumulative count of Article Views (full-text article views including HTML views, PDF and ePub downloads, according to the available data) and Abstracts Views on Vision4Press platform.
Data correspond to usage on the plateform after 2015. The current usage metrics is available 48-96 hours after online publication and is updated daily on week days.
Initial download of the metrics may take a while.