Fig. 1
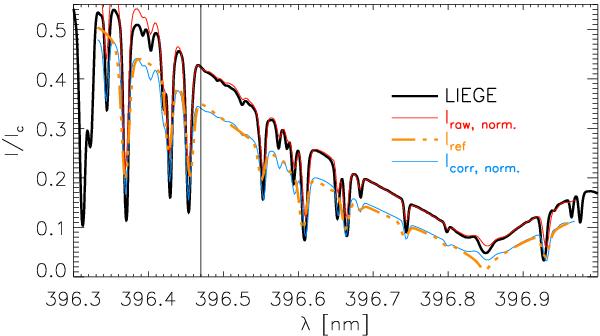
Intensity normalization and stray-light correction of the average Ca ii H profile. Thick black: LIEGE atlas profile. Thin red: normalized average observed profile Iraw,norm.. Thick orange dash-dotted: reference profile of the modified HSRA model. Thin blue: stray-light corrected average observed profile Icorr.,norm.. The black vertical line denotes the wavelength of intensity normalization.
Current usage metrics show cumulative count of Article Views (full-text article views including HTML views, PDF and ePub downloads, according to the available data) and Abstracts Views on Vision4Press platform.
Data correspond to usage on the plateform after 2015. The current usage metrics is available 48-96 hours after online publication and is updated daily on week days.
Initial download of the metrics may take a while.