Fig. 3
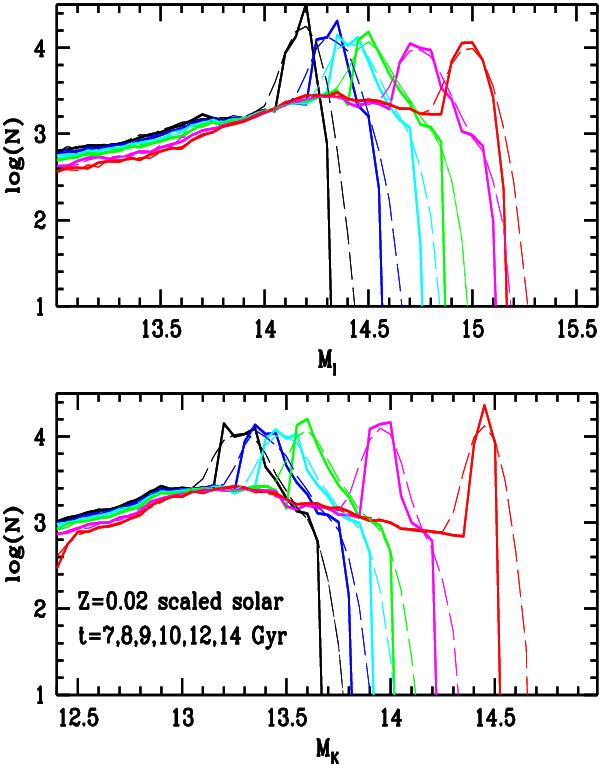
Top: predicted I-band LFs at solar chemical composition and scaled-solar chemical mixture for ages ranging from 7 to 14 Gyr (solid lines). The faint peak at the bottom end of the LF is caused by the WDBTO. Bottom: same as the panel, but for K-band LFs (solid lines). The faint peaks are caused by the WDRTO, while the bright secondary maximum centered at MK ~ 13.2 mag is caused by the CIA-induced blue TO (see text for more details). The dashed lines in both panels display the same LFs, calculated from large synthetic WD samples including a 1σ photometric error equal to 0.05 mag in both I and K (see text for details).
Current usage metrics show cumulative count of Article Views (full-text article views including HTML views, PDF and ePub downloads, according to the available data) and Abstracts Views on Vision4Press platform.
Data correspond to usage on the plateform after 2015. The current usage metrics is available 48-96 hours after online publication and is updated daily on week days.
Initial download of the metrics may take a while.