Fig. 2
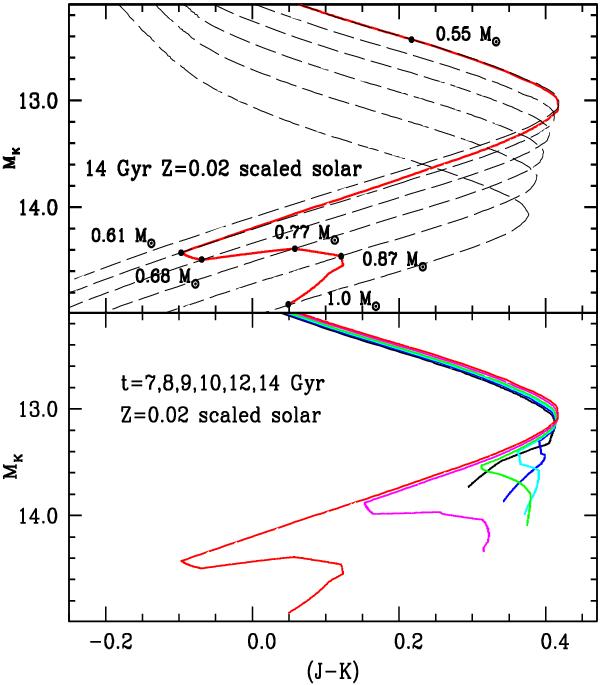
Top: near-infrared (MK, J − K) – color–magnitude diagram for a set of white dwarf cooling tracks (long dashed lines) at solar chemical composition (Z = 0.02) and scaled solar chemical mixture. The cooling tracks range from M = 0.55 to 1.0 M⊙. The red solid line shows the WD isochrone for 14 Gyr, while the black filled circles mark different mass values along the isochrone. Bottom: same as top, but for a set of white dwarf isochrones. Lines of different colors display isochrones ranging from 7 (black) to 14 (red) Gyr.
Current usage metrics show cumulative count of Article Views (full-text article views including HTML views, PDF and ePub downloads, according to the available data) and Abstracts Views on Vision4Press platform.
Data correspond to usage on the plateform after 2015. The current usage metrics is available 48-96 hours after online publication and is updated daily on week days.
Initial download of the metrics may take a while.