Fig. 1
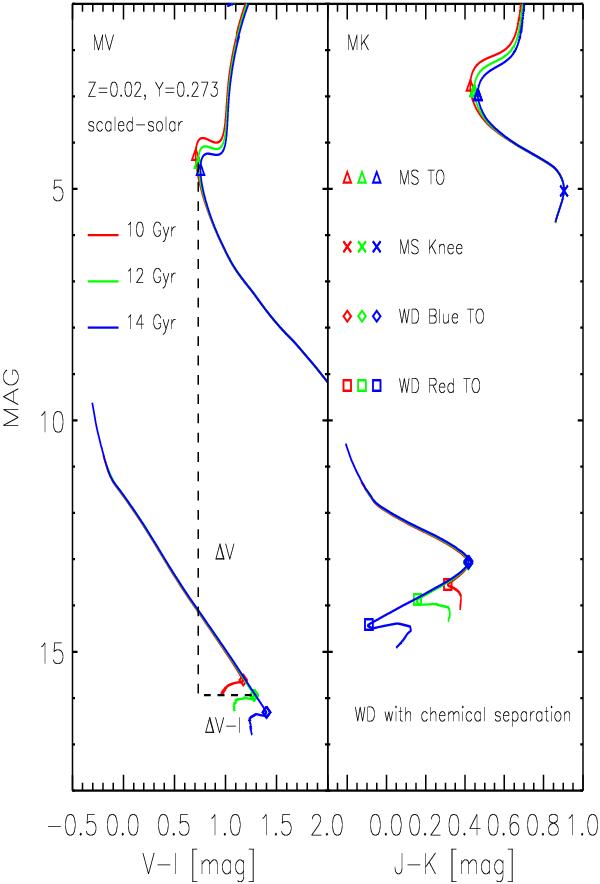
Left: predicted (V,V − I) CMD for cluster isochrones at solar chemical composition (see labeled values) and scaled solar chemical mixture. The red, green, and blue solid lines in the top right side of the panel show isochrones of 10, 12, and 14 Gyr (BaSTI data base). The triangles mark the MSTO. The red, green, and blue solid lines in the bottom left side of the panel show WD isochrones of 10, 12, and 14 Gyr. The WD isochrones account for chemical separation (Salaris et al. 2010). The diamonds mark the WDBTO. The vertical and horizontal black dashed lines display the difference in magnitude and in color between the 12 Gyr MSTO and the WDBTO. Right: same as left, but in the NIR (K,J − K) CMD. The triangles mark the MSTO, the crosses mark the MS knee (Bono et al. 2010), the diamonds mark the WDBTO, while squares mark the WDRTO.
Current usage metrics show cumulative count of Article Views (full-text article views including HTML views, PDF and ePub downloads, according to the available data) and Abstracts Views on Vision4Press platform.
Data correspond to usage on the plateform after 2015. The current usage metrics is available 48-96 hours after online publication and is updated daily on week days.
Initial download of the metrics may take a while.