Free Access
Fig. 7
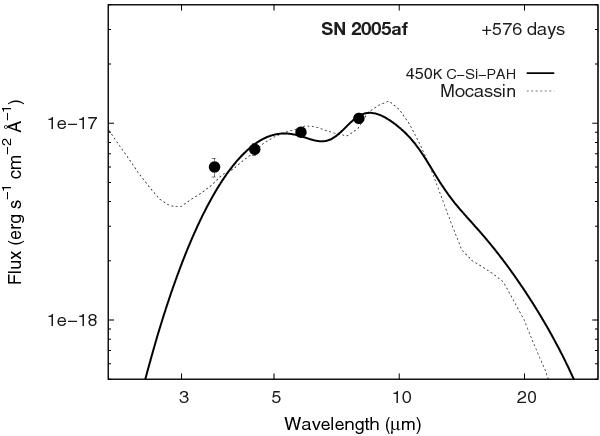
Best-fitting Si-containing analytical and numerical models for SN 2005af at +576 days (solid and dotted lines, respectively). The excess flux below 3 μm in the MOCASSIN model is due to the assumed hot central source, which was absent from the analytic models.
Current usage metrics show cumulative count of Article Views (full-text article views including HTML views, PDF and ePub downloads, according to the available data) and Abstracts Views on Vision4Press platform.
Data correspond to usage on the plateform after 2015. The current usage metrics is available 48-96 hours after online publication and is updated daily on week days.
Initial download of the metrics may take a while.