Free Access
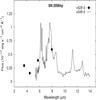
Fig. 3
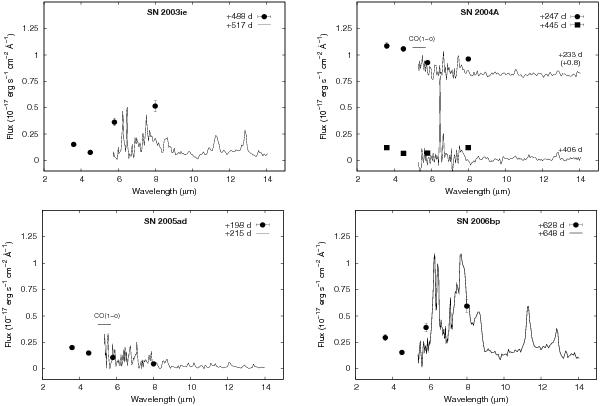
IRS spectra of SNe 2003ie, 2004A, 2005ad, and 2006bp. The spectra of SN 2004A are vertically shifted relative to each other by the amount indicated in the label next to the upper spectrum. Strong and wide emission features in the spectrum of SN 2006bp possibly emerge from nearby interstellar clouds.
This figure is made of several images, please see below:
Current usage metrics show cumulative count of Article Views (full-text article views including HTML views, PDF and ePub downloads, according to the available data) and Abstracts Views on Vision4Press platform.
Data correspond to usage on the plateform after 2015. The current usage metrics is available 48-96 hours after online publication and is updated daily on week days.
Initial download of the metrics may take a while.