Free Access
Fig. 6
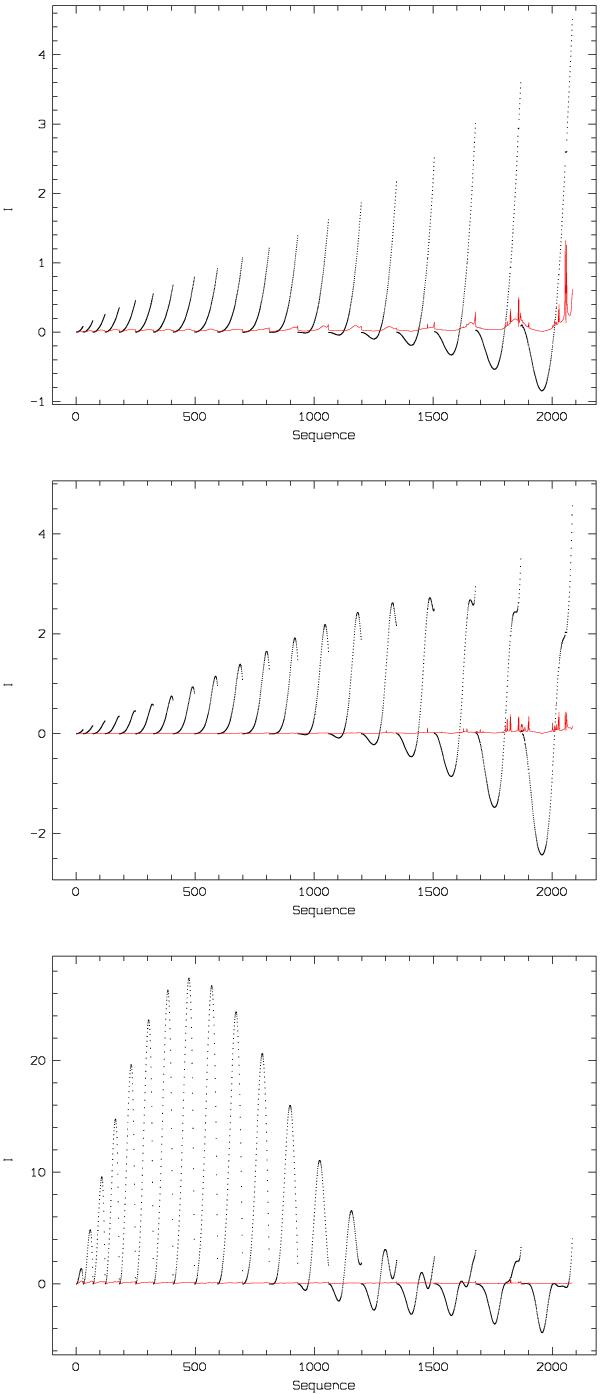
Integral I for 2085 orbits covering 19 energies. From top to bottom, fits with polynomials of order 10,16 and 22. Orbits are plotted sequentially according to their initial position xinit, and according to the energy (E = −0.95 left to E = −0.05 right). The red line is the dispersion of I multiplied by 10.
Current usage metrics show cumulative count of Article Views (full-text article views including HTML views, PDF and ePub downloads, according to the available data) and Abstracts Views on Vision4Press platform.
Data correspond to usage on the plateform after 2015. The current usage metrics is available 48-96 hours after online publication and is updated daily on week days.
Initial download of the metrics may take a while.