Fig. 4
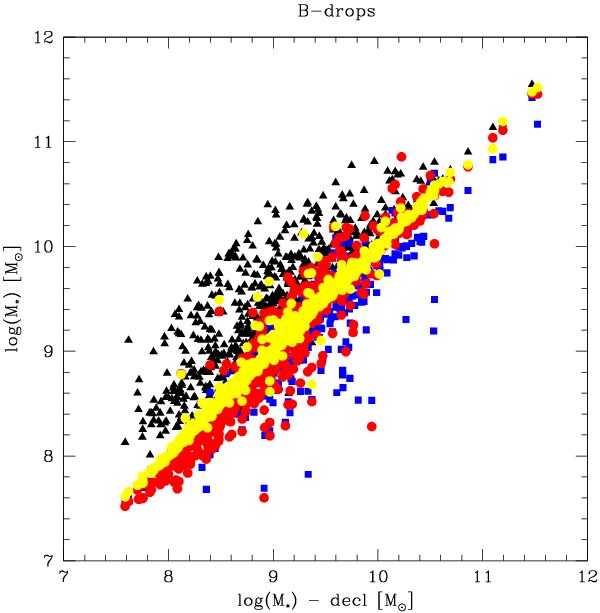
Comparison of the median stellar masses of our z ~ 4 sample with 705 galaxies derived from SED fits assuming the star formation histories listed in Table 1. The masses are compared to those derived from model A, plotted on the x-axis. Black triangles show model B with constant SFR, blue and red symbols the rising histories (model C and D respectively), yellow circles show the delayed SFHs (model E). For each model the same number of galaxies are plotted. Invisible data points are hidden close to the one-to-one relation.
Current usage metrics show cumulative count of Article Views (full-text article views including HTML views, PDF and ePub downloads, according to the available data) and Abstracts Views on Vision4Press platform.
Data correspond to usage on the plateform after 2015. The current usage metrics is available 48-96 hours after online publication and is updated daily on week days.
Initial download of the metrics may take a while.