Fig. 3
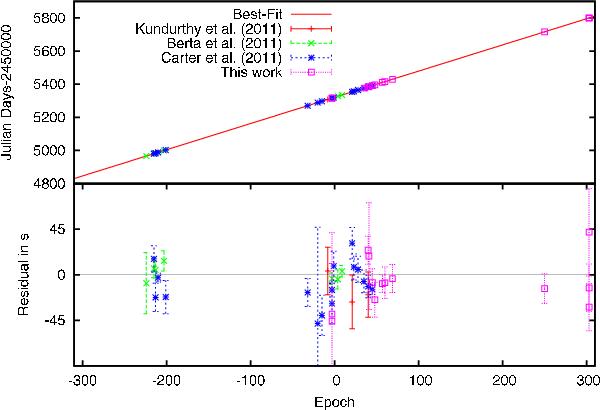
Times of mid-transit from the literature and this work. In the upper plot the errorbars are smaller than the point marker and are thus not shown. The lower plot shows the residuals on a different scale. Some of the observations are taken with instruments that simultaneously observe in several filters so some of the data points coincide in time.
Current usage metrics show cumulative count of Article Views (full-text article views including HTML views, PDF and ePub downloads, according to the available data) and Abstracts Views on Vision4Press platform.
Data correspond to usage on the plateform after 2015. The current usage metrics is available 48-96 hours after online publication and is updated daily on week days.
Initial download of the metrics may take a while.