Free Access
Fig. 2
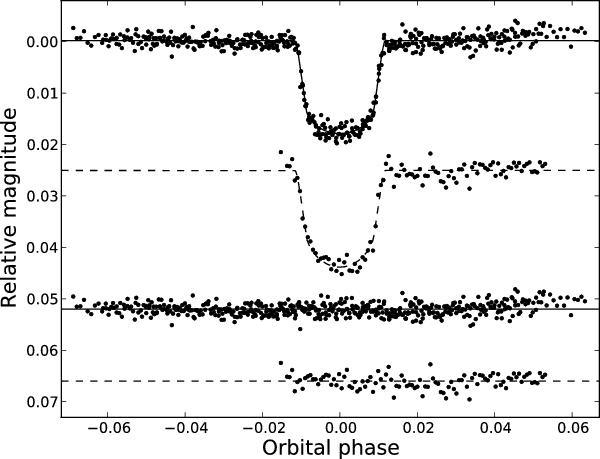
Combined Danish telescope light curve of the 2010 data (top) and the 2011 light curve (bottom), versus the best jktebop fit (solid lines 2010, dashed 2011) with the logarithmic LD law. The residuals to the fits are plotted below, where the lines mark zero residual.
Current usage metrics show cumulative count of Article Views (full-text article views including HTML views, PDF and ePub downloads, according to the available data) and Abstracts Views on Vision4Press platform.
Data correspond to usage on the plateform after 2015. The current usage metrics is available 48-96 hours after online publication and is updated daily on week days.
Initial download of the metrics may take a while.