Fig. 4
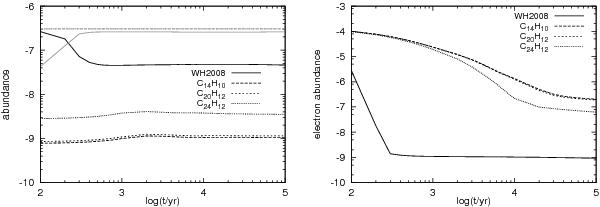
Left panel: time evolution of the abundances of PAH (grey) and PAH− (black) normalized to the total hydrogen number density (i.e. 2 × 104 cm-3). We compare the WH2008 electron attachment rates (solid) with those obtained using instead. The anthracene rates (long-dashed), the perylene rates (dashed), and the coronene rate (dotted). The lines that represent the PAH densities overlap, except those from WH2008. Right panel: electron number density time evolution as given by the same set of models. The two panels have different vertical scales.
Current usage metrics show cumulative count of Article Views (full-text article views including HTML views, PDF and ePub downloads, according to the available data) and Abstracts Views on Vision4Press platform.
Data correspond to usage on the plateform after 2015. The current usage metrics is available 48-96 hours after online publication and is updated daily on week days.
Initial download of the metrics may take a while.