Fig. 7
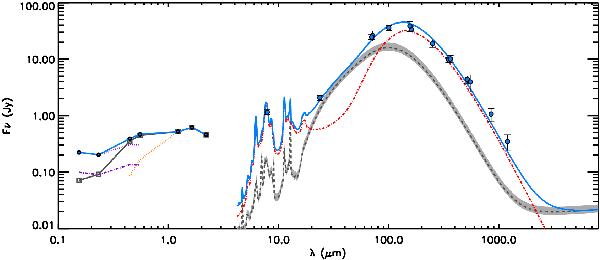
SED for the total emission of NGC 4214. In the MIR/FIR/submm part we show the best-fit solution for the total emission (solid blue line) obtained as the sum of the best-fit models of the HII regions (grey dashed line) from Figs. 4 and 5 and the best-fit model to the diffuse emission (red dashed-dotted line) from Fig. 6, obtained for  = 2.0 and
  yr-1. In the UV/optical/NIR part, the grey open squares and grey solid line represent the observational data, and the blue-filled circles and the blue solid line are the intrinsic fluxes derived from deattenuation of the observed data points as described in Sect. 6.3. The orange dotted line corresponds to the intrinsic emission of the old stellar population (see Sect. 5.2 for details). The dotted purple line shows the intrinsic emission from the young stellar population from the UV to the optical wavelength range. The emission of the young stellar population in the B and V band was obtained after subtracting the contribution of the old stellar component (orange dotted line). The purple dashed-dotted line is the scaled emission of the young stellar population by the factor needed to predict the same SFR as derived from the dust SED modelling.
Current usage metrics show cumulative count of Article Views (full-text article views including HTML views, PDF and ePub downloads, according to the available data) and Abstracts Views on Vision4Press platform.
Data correspond to usage on the plateform after 2015. The current usage metrics is available 48-96 hours after online publication and is updated daily on week days.
Initial download of the metrics may take a while.