Fig. 6
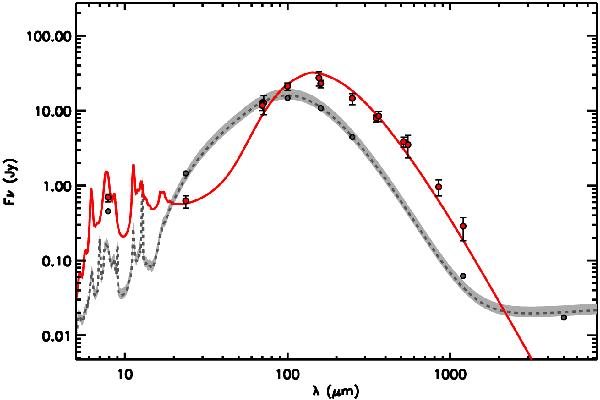
Fit to the diffuse emission of NGC 4214 keeping fixed old = 0.009 and leaving  and SFR′ as free parameters. The solid red line represents the best fit to the MIR/submm SED for the measured value of the scalelength hs = 873 pc, obtained for = 2.0, and
  yr-1. The dark grey dashed line corresponds to the sum of the best-fit models of the HII regions presented in Figs. 4 and 5, and the grey-filled circles correspond to the sum of the photometric points of NW and SE regions. The light grey area represents the uncertainty in the estimation of the total emission of the HII regions. The value of the reduced χ2 (neglecting the IRAC 8 μm and MAMBO points) is 1.82.
Current usage metrics show cumulative count of Article Views (full-text article views including HTML views, PDF and ePub downloads, according to the available data) and Abstracts Views on Vision4Press platform.
Data correspond to usage on the plateform after 2015. The current usage metrics is available 48-96 hours after online publication and is updated daily on week days.
Initial download of the metrics may take a while.