Free Access
Fig. 2
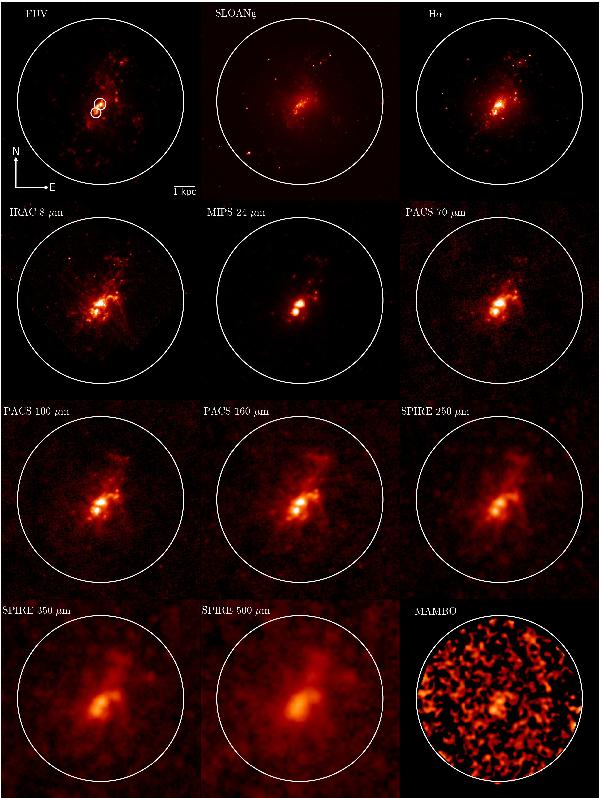
Images of NGC 4214 at different wavelengths. The large circle shows the aperture that we chose for the entire disk emission and the smaller circles in the top-left panel the apertures to measure the emission from the HII regions NW and SE.
Current usage metrics show cumulative count of Article Views (full-text article views including HTML views, PDF and ePub downloads, according to the available data) and Abstracts Views on Vision4Press platform.
Data correspond to usage on the plateform after 2015. The current usage metrics is available 48-96 hours after online publication and is updated daily on week days.
Initial download of the metrics may take a while.