Fig. 8
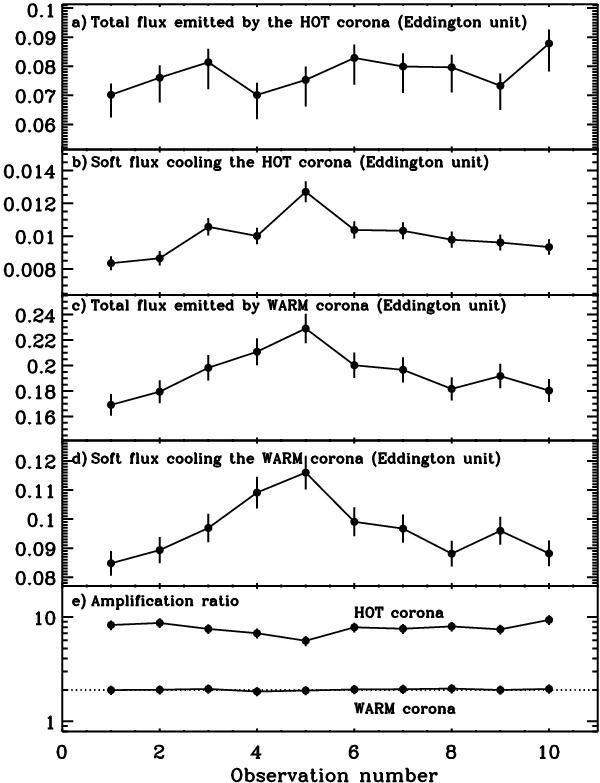
a) Total flux Ltot/LEdd emitted by the hot corona and b) intercepted soft photon luminosity Ls/LEdd entering and cooling the hot corona. c) and d), like a) and b) but for the warm corona. e) Compton amplification ratio Ltot/Ls for the warm (bottom curve) and hot (top curve) coronae, respectively. The dotted line in e) is the expected value for a thick corona in radiative equilibrium above a passive disk. All the luminosities are in Eddington units assuming a black-hole mass of 1.4 × 10⁸ M⊙. The error bars on Lobs and Ls have been estimated as on the order of 5%.
Current usage metrics show cumulative count of Article Views (full-text article views including HTML views, PDF and ePub downloads, according to the available data) and Abstracts Views on Vision4Press platform.
Data correspond to usage on the plateform after 2015. The current usage metrics is available 48-96 hours after online publication and is updated daily on week days.
Initial download of the metrics may take a while.