Fig. 7
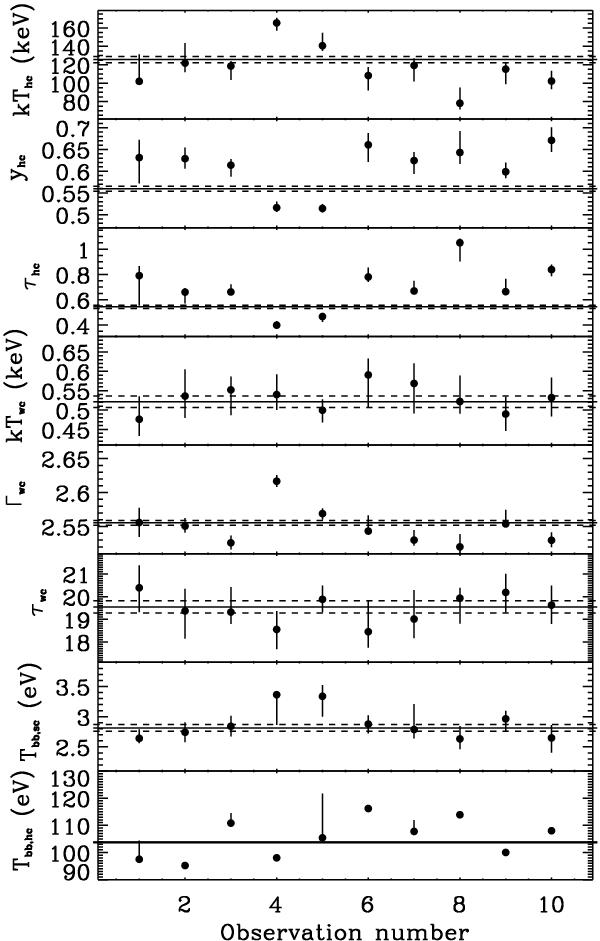
Time evolution of the different fit parameters. From top to bottom: the hot corona temperature kThc, Compton parameter yhc, optical depth τhc, and the warm corona temperature kTwc, photon index Γwc, optical depth τwc, and the soft photon temperatures Tbb,wc and Tbb,hc. The solid lines show the best-fit constant values and the solid lines the ± 1σ uncertainties.
Current usage metrics show cumulative count of Article Views (full-text article views including HTML views, PDF and ePub downloads, according to the available data) and Abstracts Views on Vision4Press platform.
Data correspond to usage on the plateform after 2015. The current usage metrics is available 48-96 hours after online publication and is updated daily on week days.
Initial download of the metrics may take a while.