Fig. 5
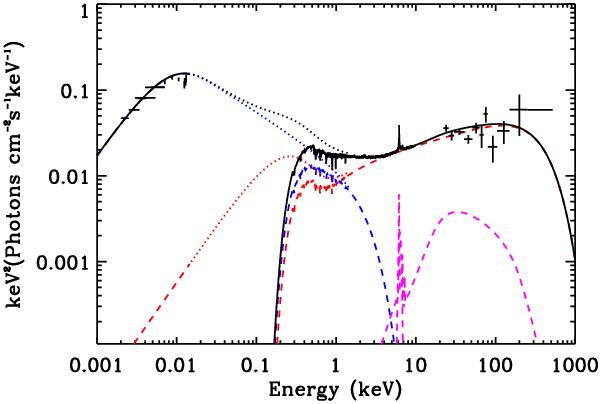
Unfolded best-fit model of the total data spectrum using a thermal Comptonization component (compps in xspec) for the primary continuum. The data are the black crosses. The solid black line is the best-fit model including all absorption (WA and Galactic). The dashed lines correspond to the different spectral components, hot (in red) and warm (in blue) corona emission as well as the reflection (magenta) produced by pexmon including the effects of absorptions, while the dotted line are absorption free.
Current usage metrics show cumulative count of Article Views (full-text article views including HTML views, PDF and ePub downloads, according to the available data) and Abstracts Views on Vision4Press platform.
Data correspond to usage on the plateform after 2015. The current usage metrics is available 48-96 hours after online publication and is updated daily on week days.
Initial download of the metrics may take a while.