Fig. 3
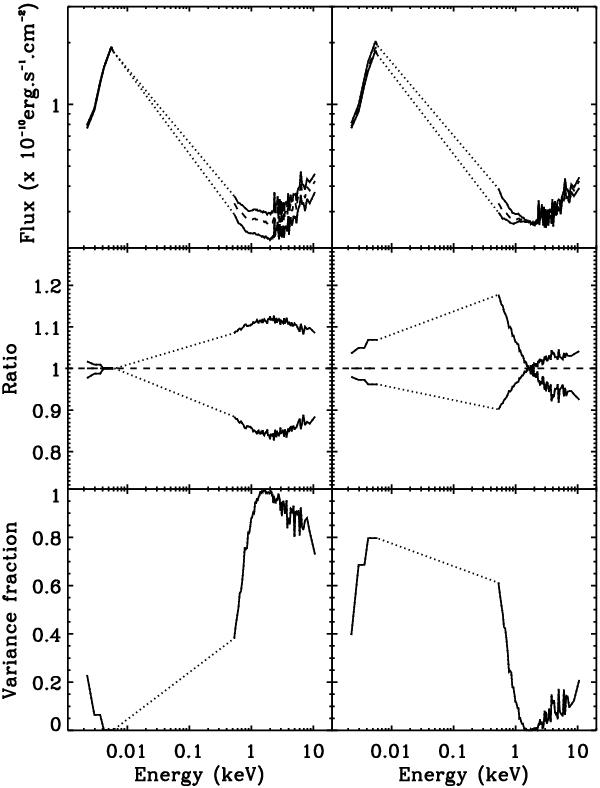
First (left panels) and second (right panels) principal components of variability. The upper panels show the spectra corresponding to the maximal and minimal coordinate αj,k over the j = 10 observations of the first (k = 1, left) and second (k = 2, right) eigenvectors. The middle panels show the ratio of the maximum and minimum spectra to the total spectrum of the source. The bottom panels show the contribution of each component to the total variance as a function of energy.
Current usage metrics show cumulative count of Article Views (full-text article views including HTML views, PDF and ePub downloads, according to the available data) and Abstracts Views on Vision4Press platform.
Data correspond to usage on the plateform after 2015. The current usage metrics is available 48-96 hours after online publication and is updated daily on week days.
Initial download of the metrics may take a while.