Fig. 2
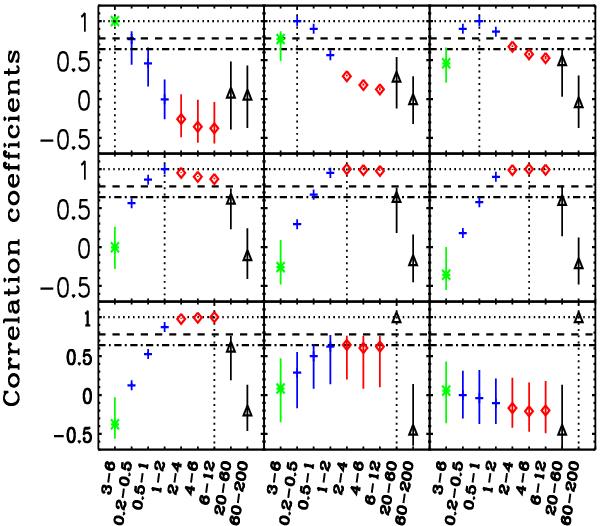
Count rate-count rate correlation coefficients between different energy bands for the 10 observations. In each panel, the green star is the XMM-Newton/OM light curve in the 3−6 eV band; the three blue crosses correspond to the XMM-Newton/pn soft X-ray bands: 0.2−0.5 keV, 0.5−1 keV, 1−2 keV; the three red diamonds correspond to the XMM-Newton/pn medium X-ray bands: 2−4 keV, 4−6 keV, 6−12 keV; and the two black triangles correspond to the INTEGRAL/ISGRI hard X-ray bands: 20−60 keV and 60−200 keV. In each panel, the light curves are correlated with the one marked with the vertical dotted lines. We have overplotted the 95% and 99% confidence levels for the significance of the correlation (it corresponds to correlation coefficients of 0.64 and 0.78, respectively, for 10 points) with horizontal dot-dashed and dashed lines, respectively.
Current usage metrics show cumulative count of Article Views (full-text article views including HTML views, PDF and ePub downloads, according to the available data) and Abstracts Views on Vision4Press platform.
Data correspond to usage on the plateform after 2015. The current usage metrics is available 48-96 hours after online publication and is updated daily on week days.
Initial download of the metrics may take a while.