Fig. 12
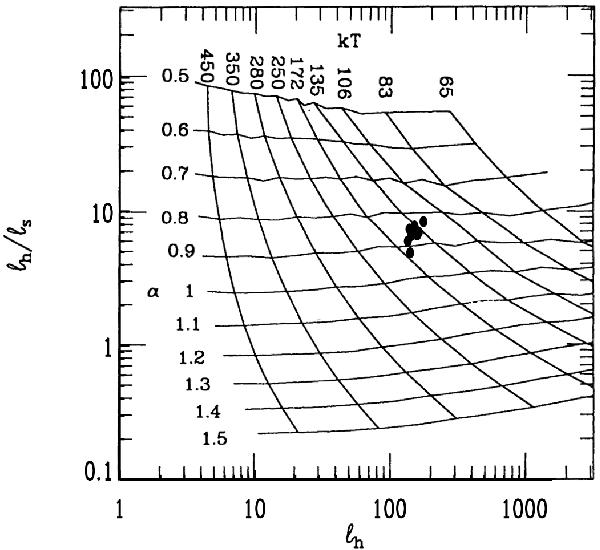
Hard-to-soft compactness ratio lh/ls vs. hard compactness ls. The figure is extracted from Ghisellini & Haardt (1994). It shows the one-to-one correspondence between the spectral characteristics of the Compton spectrum of a pure pair plasma (energy spectral index α and temperature kT) and the soft and hard compactnesses.The black points correspond to the 10 observations of Mrk 509.
Current usage metrics show cumulative count of Article Views (full-text article views including HTML views, PDF and ePub downloads, according to the available data) and Abstracts Views on Vision4Press platform.
Data correspond to usage on the plateform after 2015. The current usage metrics is available 48-96 hours after online publication and is updated daily on week days.
Initial download of the metrics may take a while.